
Bridget Freidel
Lean Practitioner Certification Project
Date: 3/25/2020
Company Name: Thomson Reuters, Core Publishing Solutions
Applicant: CI/Lean Business Process Analyst
The Project Name: Machine Optimization
The Team: Department Supervisors & Operators
The Company Description:
Thomson Reuters provides the intelligence, technology, and human expertise needed to find trusted answers for professionals across three different industries: Legal, Tax & Accounting, and News & Media.
One of the key business areas within Thomson Reuters is Global Print. We are a book manufacturer located on the Eagan, MN (1.3 million square foot) campus. We are among the top 10 book manufacturers in the United States providing digital, offset, and eBook solutions for Legal and 3rd Party customers.
http://corepublishingsolutions.thomsonreuters.com/
Problem Statement:
The average machine up-time over September and October 2019 was X% with standard deviation of 2.5%. This line is critical to our value stream, and the lack of performance can prompt needed overtime to meet customer demand and causes frequent disruption to operator and maintenance team members. The goal of this project is to apply DMAIC and Lean ideology to increase the average monthly machine up-time from X% to Y% by January 31st, 2020.
The process scope consists of the Gatherer to the Palletizer of the equipment line. Throughout the project timeline, a team will be solving the mechanical issues of the equipment, but this specific project team is focused on the prevention of future issues.
Timeline:
| Milestone | Owner | Due Date | Completion Date |
| Gain Access to equipment data | Applicant & Supervisor | 11/1/2019 | 11/1/2019 |
| Develop changeover, calibration, and template Standard Work Instructions | Applicant | 11/15/2019 | 11/15/2019 |
| Analyze data | Applicant | 11/22/2019 | 11/22/2019 |
| Develop Fishbone Diagram for Root Cause Analysis | Applicant | 12/6/2020 | 11/11/2020 |
| Implement Preventative Maintenance Schedule | Applicant & Supervisors | 1/1/2020 | 1/1/2020 |
Lean Tools Used:
- DMAIC
- Root Cause Analysis: Fishbone Diagram
- Standard Work Instructions
- Preventative Maintenance
Current State:
The equipment has capabilities to process both hardbound and softbound books. It is one of the most efficient machines in our value stream today, so it is essential that it runs productivity. There are typically three to four operators staffed at a time, and it runs on all three shifts. An overview of the current state process is as follows, where each color corresponds to a different operator. Additionally, there are multiple quality checkpoints throughout the process.

Picture 2: Current State Process
Throughout October and November 2019, technicians visited our site to repair and upgrade the equipment. The team was experiencing key equipment errors, which prompted the start of the Machine Optimization Project. For example, the first week of November had an average of A faults/day and B stops/day. The techs noted that the equipment was not being calibrated regularly, so the machine measurements were slightly off. At the time, the only written documentation operators referred to were the operating manuals.
Current State Activity Code Pareto:
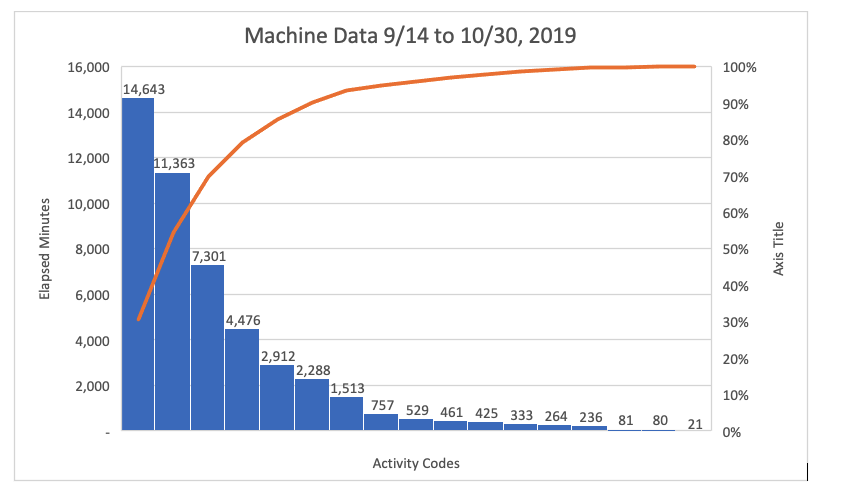
The pareto shown above is for the machine showing the elapsed minutes the system is in for the different activity codes within a range of dates. The largest source of unplanned downtime according to the graph in October was “Auto-stops”. Auto-stops are defined as time where the binder is loaded with a job, but the books are not moving due to a fault or stop. Looking at the graph, the second largest source of unplanned downtime was “Emergency Maintenance”. The team anticipates challenges with the mechanical and software aspects of the equipment that would require technician support and communication between three shifts.
Goals:
The project goals included:
| Goal | Current | After | Results |
| Improve Uptime % on the Equipment
Y%
|
Alegro average Uptime %
X% |
||
| Create standard work instructions for changeovers, calibration, and template usage.
Attain 100% |
No standard work instructions exist.
0%
|
||
| Improve PM Completion Rate
Attain at least 95% |
PM Completion Rate
50%
|
Major Project Activities and Challenges:
Standard Work Instructions
While the technicians were visiting, I recorded video of their demonstrations for how to properly operate and maintain the equipment. We created the following visual, standard work instructions by referring to the videos, technician feedback, operator feedback, and operating manuals to standardize the best-known process.
- Changeovers
- Referencing (Calibration)
- Template Usage
I included a picture in each step to make the instructions visual and easy to follow. Many of the setup tasks use the control console. Icon descriptions are included with the corresponding functions. To ensure the documents are easily retrieved when needed, we added them as pdfs to the network drive as a desktop shortcut on all the computers along the equipment line. This way, an operator can quickly retrieve the instructions, and if an update is needed, the network folder owner can change all of the files at once.
Root Cause Analysis
The team brainstormed causes of downtime using the following root cause analysis fishbone diagram with the categories of Equipment, Process, People, Environment, Maintenance, and Metrics. We referenced the fishbone diagram when brainstorming improvement actions to reduce/remove the causes of downtime.
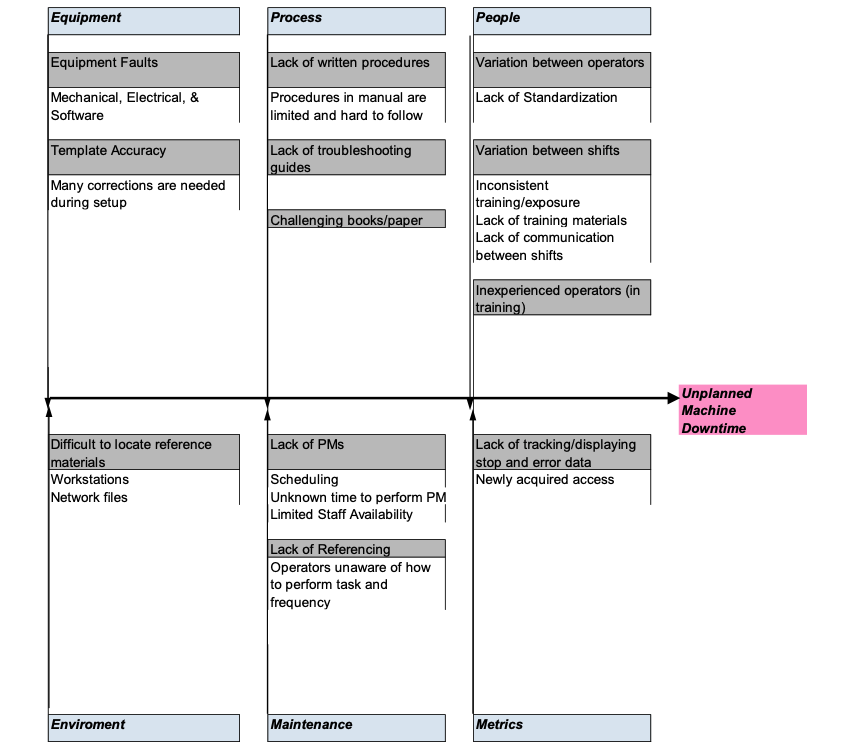
The major causes the team decided to tackle initially were related to the equipment faults and variation between operators. The purpose of the standard work procedures is to reduce variation in how operators perform tasks ensuring the best-known practice is followed. These documents will also be an aid for training new employees. We decided to create a Preventative Maintenance schedule for all operator level maintenance tasks, to ensure the equipment remains in good condition and is less likely to fault.
Preventative Maintenance (PM)
Due to the difficulty of balancing the time for operator level maintenance and keeping up with production needs, a regular PM schedule has been developed that began at the start of the year. The team evaluated the current list of PM tasks and identified two of the tech’s recommendations that were missing: clean the pockets biannually and calibrate the equipment weekly. These were added to the PM list. We measured the amount of time needed per task to aid in determining the block of times allowed for operators to complete the tasks (27 tasks total). 25 of these tasks occur monthly, 1 occurs weekly, and 1 occurs every other week (See Appendix A for a picture of the PM Schedule). All monthly tasks are completed at the same time within a full shift. The team has started looking for ways to reduce the amount of time needed for some of the longer, complex tasks.
Scheduling Process
- 1st shift supervisor emails the date of the monthly PMs to the schedulers 2-weeks in advance. This date must fall within the first week of the month.
- 1st shift operators complete all monthly tasks on scheduled date.
- 2nd shift operators complete all weekly tasks on Fridays.
- Operators review schedule on Tier Board and check off when completed.
One of the challenges we faced was the implementation of PMs on 2nd shift as they have never had to do PMs in the past. Looking back on it, we could have more directly communicated with the operators to better walk them through the new expectations and how the schedule works. They were not used to viewing or updating our Preventative Maintenance tab in our system, which indicates when tasks are late. We overcame this challenge by monitoring the results, noticing the gap, and then communicating with the operators and supervisor.
Results and Final Conditions:
| Goal | Current | After | Results |
| Improve Uptime % on the Alegro
Y%
|
Alegro average Uptime %
X% |
January Average Uptime
A%
March Average Uptime B%
|
The average monthly uptime on the Alegro has improved by
4.5% to date. |
| Create standard work instructions for changeovers, calibration, and template usage.
Attain 100%
|
No standard work instructions exist.
0%
|
7 standard work instructions created
100% |
Improved by 100% |
| Improve PM Completion Rate
Attain at least 95% |
PM Completion Rate
50%
|
PM Completion Rate as of March
95.4% |
Improved by 45.4% |
The team did not achieve the Y% uptime goal in January but did make an improvement to A%. In March, the uptime improved to B%. Although the goal was not met, we are continuing efforts in 2020 to meet Y% and sustain. The standard work instructions were all completed, and the PM schedule has been implemented successfully. We have seen sustained positive results in our activity code tracking as a result of the PM schedule and Standard Work Instructions (see below). There have been less disruptions to operator and maintenance crews.
Final Condition Activity Code Pareto:
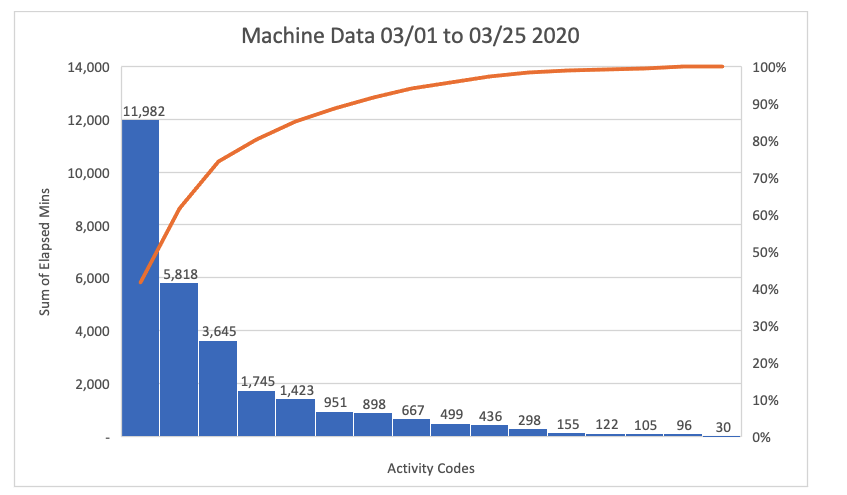
The Auto Stop and Emergency Maintenance have reduced dramatically. The Auto Stop category remains the largest source of downtime, and the team will continue to address it in Part 2 of the project. As a result of the PM schedule, the equipment condition is improved and is cleaner with more regular attention given to maintenance and removing paper dust/glue build up. The emergency maintenance crews now have more availability to work on other equipment in need across the facility.
Sustainment
Sustainment initiatives included:
- A checklist on the bottom of the PM schedule for operators to mark off tasks after completion. The list is posted on their Tier Board, where all shift start meetings are held.
- 1st Shift Hardbound supervisor and 2nd Shift Supervisor own the sustainment of the Preventative Maintenance schedule.
- 1st Shift Supervisor and I hold weekly check-in meetings on project progress. These meetings are reoccurring throughout 2020 for future improvements as well.
- The activity code breakdown is being monitored on a monthly basis.
- The Standard Work Instructions are in a folder on the desktop of the equipment computers to ensure easy access and that the documents will not be lost.
Conclusions/Lessons Learned
Part 1 of the Equipment Optimization Project focused on the reduction of mechanical faults, improved upkeep of equipment, and the creation of standard work materials. We will continue to work towards a Y% average uptime goal, and then raise the goal after a period of sustainment. The next part of the project will focus on reducing setup time and implementing a new Tier Board solution. There may be opportunities to create PM schedules on other critical equipment in our Bindery as well.
Lessons Learned
- I learned how Auto-Stops are measured.
- Communication is key to project success and sustainment.
- The uptime % goal was too high for the timeline given to the project. I could have picked a more attainable goal and then raised to Y% after a period of sustainment.
- It would have beneficial to get more operators involved in the fishbone diagram creation.